


Tired of Excel reports contradicting each other? Do you have a myriad of operational reports but not the information you need? Would you like to present reliable performance indicators to engage your employees?
Business Intelligence (BI) can end your suffering!
BI Concepts
BI concepts revolve around dashboards, architecture, and key roles.
Dashboards
Dashboards are the end product by which users consume information. They are used to manage, analyze trends, and track the company’s activities. They are integrated using visualization tools, such as Power BI, that connect to data marts.
Dashboards can be grouped into three categories.
Strategic Dashboard
It is used to report on the organization’s performance in relation to strategic objectives. Indicators are generally divided according to financial focus, client perspective, internal processes, and human resources to assist upper management in their decision-making process.
The strategic dashboard becomes a powerful management tool when indicators are linked to tactical and operational reports. Since this tool is used to guide the company towards its future vision, a delay ranging from a week to a month for data access would be deemed acceptable.
Tactical Dashboard
It is primarily used by middle managers to provide analysts with open access to data. It translates strategic objectives into medium-term plans, helping to link strategy to day-to-day operations. It is the preferred analytical tool for trending.
Over time, as your business knowledge improves, identification of key leading performance indicators will become easier, which, in turn, will improve your ability to quickly identify and correct abnormal situations.
Operational Dashboard
It uses data often closely related to transactional systems. It’s an important tool for front-line managers. At a glance, you can see how activities compare to day-to-day objectives, allowing for quick decision-making to correct unwanted situations.
Features can be added to zoom in to the transaction level so that users can trust the data presented to them. It is essential to use data as close to real time as possible. A 15 to 30-minute delay is generally deemed acceptable for data access.
Date Architecture
 There are a number of technical solutions for BI. It is recommended to analyze business needs and model the desired architecture before selecting a product. Regardless of the products selected, you will be required to perform the following functions.
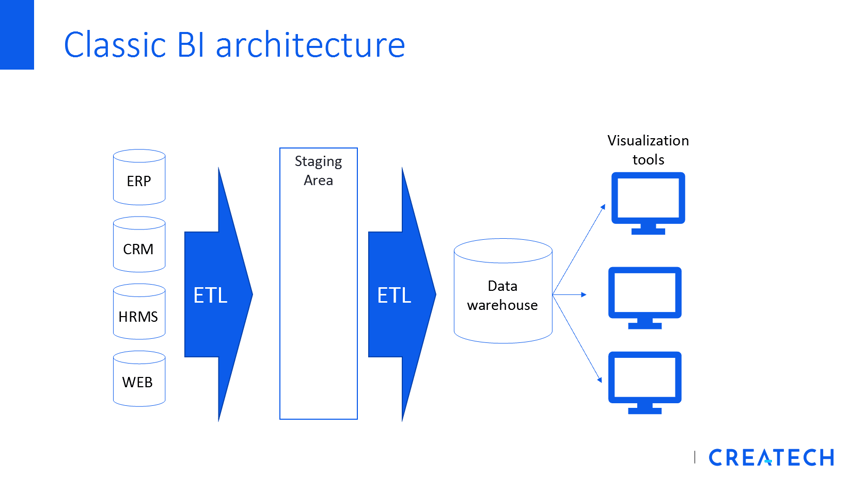
Extract—Transform—Load (ETL)
ETL is used to extract data from source systems, transform, and deliver it into the data warehouse. There are several possible transformations:
- Consolidation of data from different source systems to create global analysis objects. For example, the Web Sales System, Enterprise Software Package (ERP), and Point-of-Sale customer tables could be consolidated to provide an overall vision.
- Data calculation using business rules recognized by the company; When does a sale take place? When the customer places the order? When they receive the material? When they pay?
- Validation of data quality. Processing rules can be added to correct some quality errors. It is best to limit corrections to the ETL and prioritize modifying transactional systems.
Data Marts and Warehouses
A database management system is required to store the loaded data that will become your Holy Grail. There are several types of architectures. The Kimbal model, which groups data marts according to common dimensions, is generally the easiest and fastest to implement.
Visualization Tools
Visualization tools (Power BI, SAP Analytics Cloud, NetSuite SuiteAnalytics ou Oracle JDE EnterpriseOne) are connected to data marts and enable the generation of reports and dashboards containing quality information. By loading dimensions that are enterprise-wide, your reports will use a common baseline that allows for comparative analyses. Recent visualization tools are dynamic and allow you to quickly query reports and find answers.
 Key Roles
Data Owner
Time and resources are spent generating quality indicators; they need to be relevant and used frequently. Each indicator should have an owner, often an intermediary manager. This person warrants the value of the indicator. The Data Owner is responsible for communicating the correct results and taking appropriate corrective actions if the indicator does not meet the intended parameters.
Data Custodian
This person is from the business sector and is very familiar with its transactions and processes. Custodians maintain documentation of the various indicators to ensure knowledge continuity. They are the go-to person in the department for any questions relating to interpretation. They identify quality errors and work with IT or ETL to correct them.
Business Alignment / IT
Unlike transactional systems designed to be stable for long periods of time, information needs evolve. Reporting requests are growing although IT generally considers them low priority and puts them at the bottom of the backlog. The business function frequently receives its reports too late, and these often involve errors in quality or interpretation of business rules.
Frustrated, some managers turn to analysts who can extract and transform data without IT’s knowledge. The reports generated will then be poorly documented, unstable over time, and will frequently contradict other reports already in use. This confusion leads to dissatisfaction among managers, who then make decisions based on intuition rather than facts.
In a BI environment, responsibilities are shifted: the business function acts as the decision maker and owner of the tool, while IT supports the architecture.
To connect the business function with IT, it is best to work with a BI specialist who speaks both business and IT languages. Their role will be to gather business needs, create the data model for the warehouse and accompany the super users in creating the dashboards once the ETL is under way.
Your First BI Project
You finally have the support of a sponsor to start a BI project. It is recommended to limit the scope of the project and target a specific department in order to generate quick gains. Resource planning and sales are two areas where emerging trends will lead to gains that are easy to quantify. The departments interested will be good candidates to start.
The methodology includes the following steps:
- Gathering metrics and dimensions for analysis;
- Validating the calculation rules for these metrics;
- Mapping data sources;
- Creating mock-ups to validate requirements collected;
- Profiling data quality of source systems (and determining remediation rules and processes);
- Loading the data marts (ETL) with the rules collected during the needs analysis;
- Connecting visualization tool to data marts;
- Formalizing a first tactical dashboard;
- Training super users to query the data mart to extract new trends and quickly create new reports;
- Drilling data to discover new trends to be inserted into the dashboard.
Your BI solution will provide access to reliable data, calculated according to your business context, and delivered when you need it. You will then be able to include new departments incrementally.
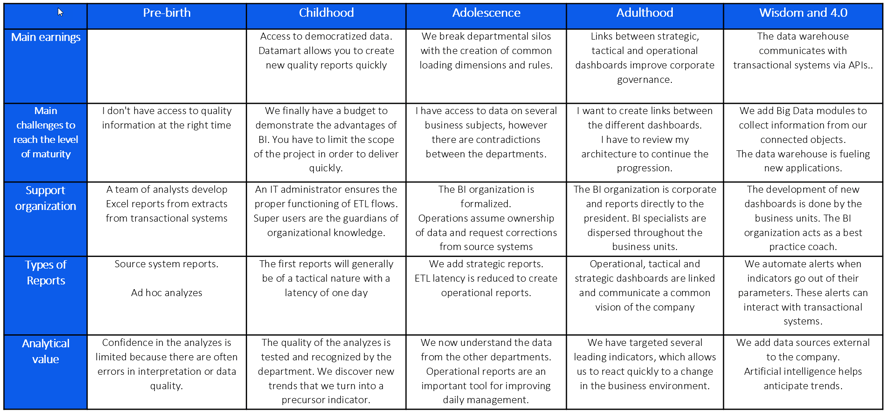
It will also be possible to increase the value delivered to the organization by increasing your level of BI maturity. The following table is used to gauge your organization’s level of maturity and provide you with an overview of the gains achievable at the next level.
 Conclusion
BI is a collection of technology tools that draws its value from the support of its organization and its processes. The infrastructure used makes it possible to democratize information throughout the company. Upper management strategic dashboards are linked to middle manager tactical dashboards as well as operational reports. These links make everyone’s scope of the company’s objectives a reality, making it easier to manage.
Through maturity in BI, we acquire knowledge of leading indicators that were previously unknown to us. These indicators allow us to quickly identify changes in our business environment and measure the scope of our decisions.
Access to data is becoming an increasingly common convenience. BI technologies are now mature. The next 4.0 economic revolution is likely to be supported by data. It is therefore important to invest today in order to ensure your competitiveness tomorrow.
