


In this blog, I will demonstrate how to visualize your data with Power BI from the customer relation management solution, Microsoft Dynamics 365 CRM, in less than 10 minutes!
Microsoft has made great strides in the field of SaaS (Software as a Service) applications over the last few years. More popular than ever, Power BI positions itself today as one of the best data visualization solutions on the market.
Although this tutorial is “sales-oriented” using Microsoft Dynamics 365 CRM, note that Microsoft offers the same possibilities with its Customer Service, Marketing and ERP modules.
Required for the purpose of this tutorial
To be able to follow our tutorial, you will need:
- Microsoft Dynamics 365, equipped with the “Sales” modules;
- A Power Bi account https://powerbi.microsoft.com using the same user account as your Microsoft Dynamics 365 instance (crucial).
If you do not have the “Sales” Microsoft Dynamics 365 instance, you can install a 30-day trial version here.
Linking Power BI to Microsoft Dynamics 365 CRM
Power BI is available in 44 languages. To change the language settings, go to Settings – General – Language and select the language of your choice.
Installing “Sales Analytics for Dynamics 365”
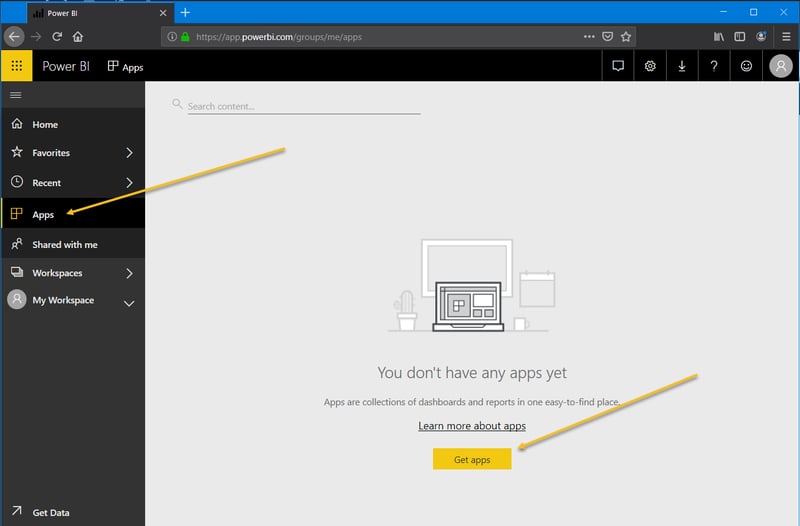
Always trying to make applications easily accessible, Microsoft developed some applications within Power BI. In the left-end side menu, got to Apps and click Get apps:
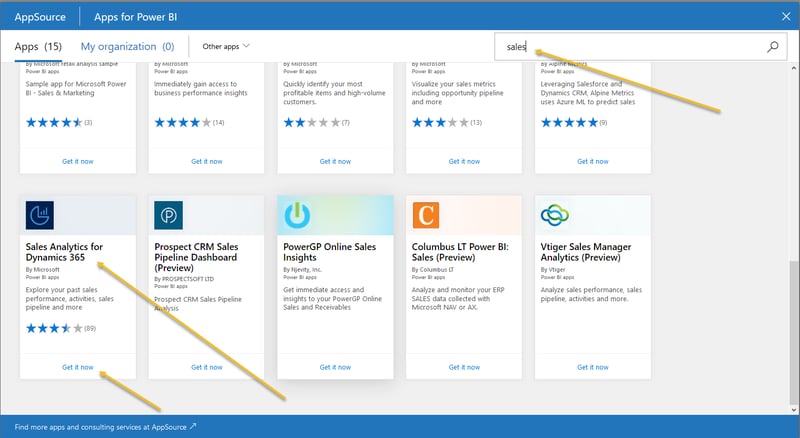
In the search field, type the application’s name Sales Analytics for Dynamics 365:
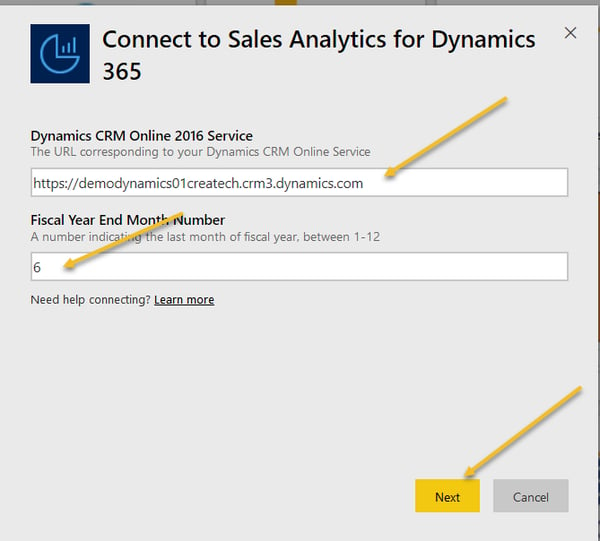
To connect the Sales Analytics for Dynamics 365 app to your Microsoft Dynamics 365 CRM, add your Microsoft Dynamics 365 CRM’s URL and enter the month corresponding to the end of your fiscal year:
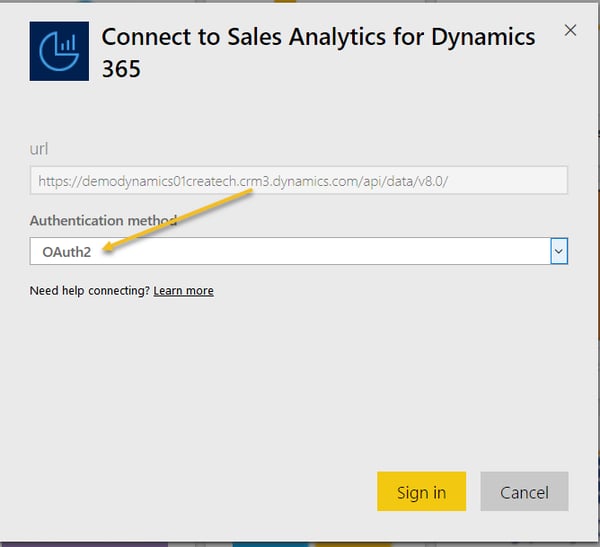
To be able to connect from Power BI to Microsoft Dynamics 365 CRM, I suggest using the “OAuth2” option:
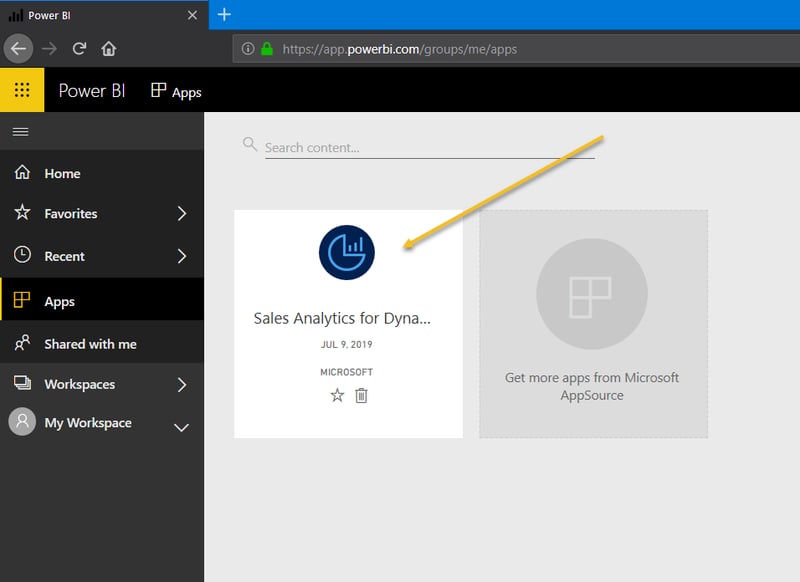
You can now access the “Sales Analytics for Dynamics 365” application:
Visualizing your data in Power BI
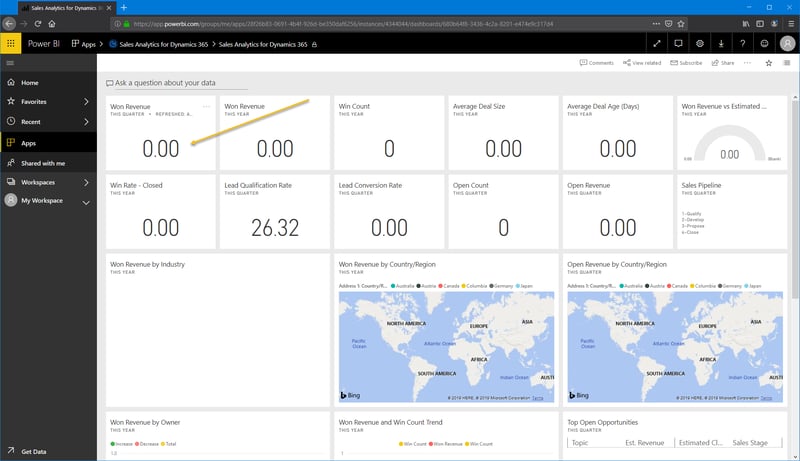
For the purpose of this tutorial, I will use data from Microsoft Dynamics 365 trial version so you can replicate the same. Consequently, when you open the application you just installed, you will note that graphs are empty:
With a simple change of filters, I can adjust the context and go on with my task.
Here is an example to complete in one of the application’s tabs. Chose every fiscal period instead of the current period:
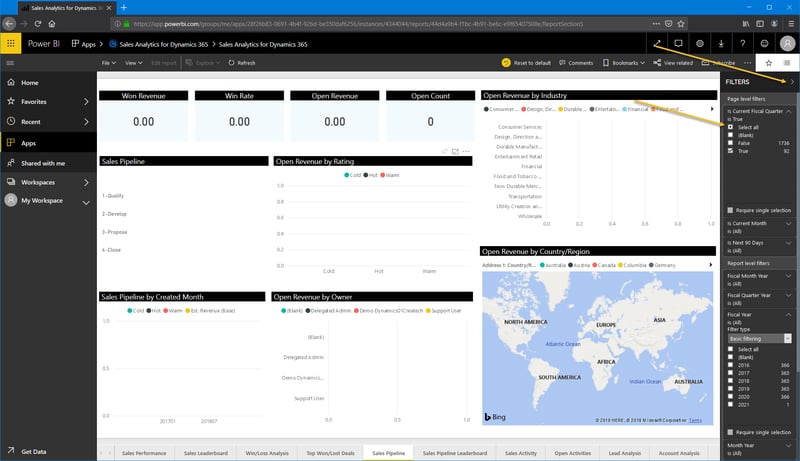
You are now able to see graphs:
Top 10 Best Microsoft Dynamics 365 CRM Reports
Microsoft Dynamics 365 CRM offers 10 default tabs, each containing several reports.Here are the ones that, according to me, have the greatest value-add:
In the “Sales Analytics” tab
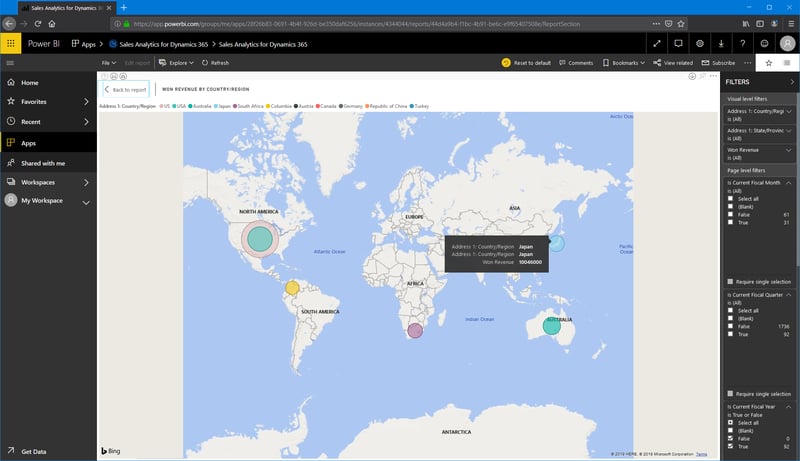
1. The report named “Won Revenue by Country/Region” provides a geographical distribution of the opportunities gained from your sales process:
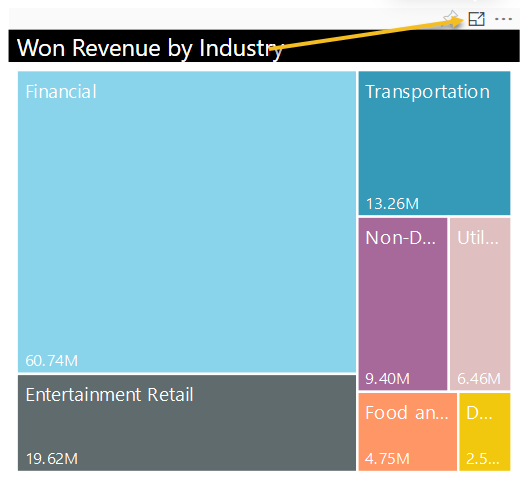
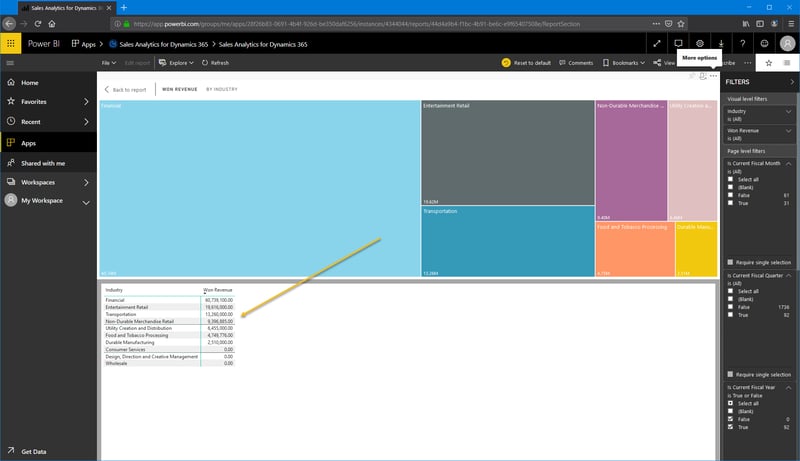
2. The report named “Won Revenue by Industry” is a dashboard sorted by “category”. This allows you to choose different categories/criteria depending on your needs:
Note that you can see more data by simply clicking “Show data”:
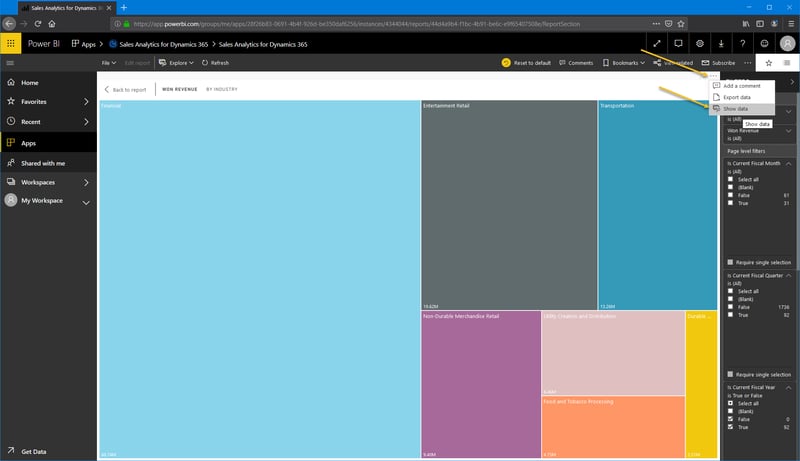
The source table of this report is displayed at the bottom of the graph. You can use the same procedure for all your reports, without exception.
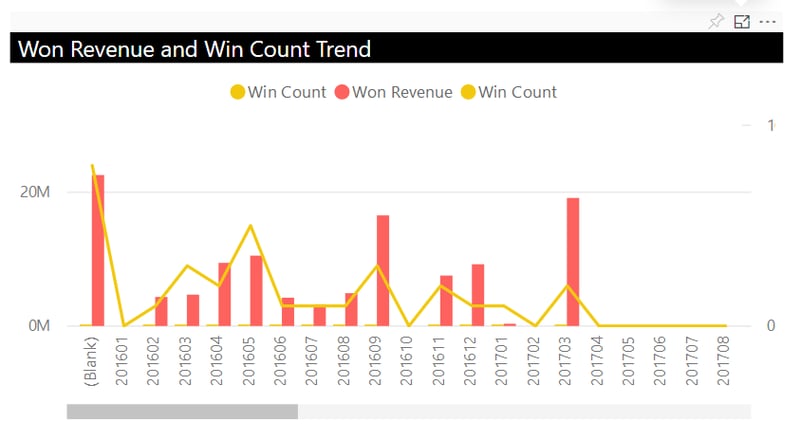
3. See your sales trend by accessing the report named “Won Revenue and Win Count Trend”:
In the “Lost/Gained Sales Analytics” tab
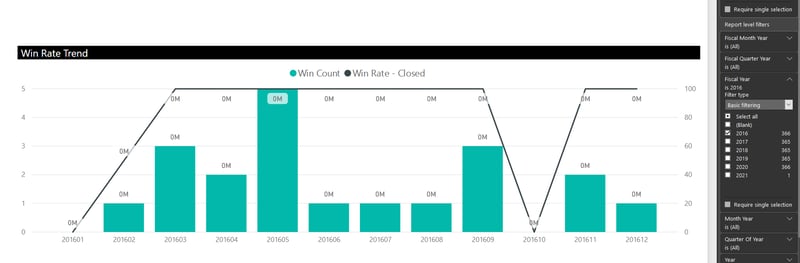
4. “Win Rate Trends” tab gives you the possibility to see the monthly trends of Won Opportunities:
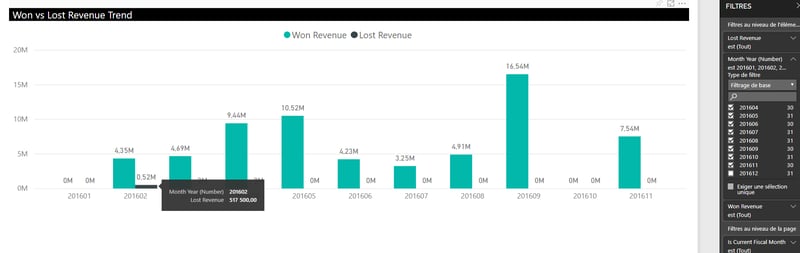
5. In the same tab, the report named “Won vs. Lost Revenue Trend”:
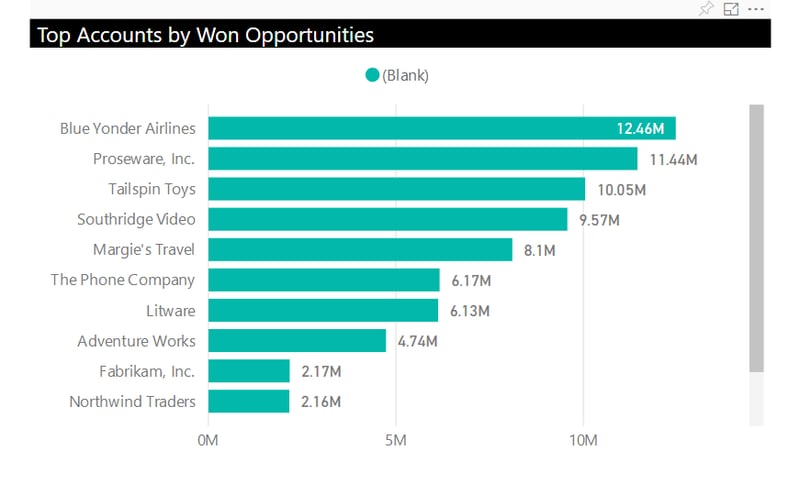
In the “Top Accounts by Won Opportunities” tab
6. You can visualize your “Revenue per Account”:
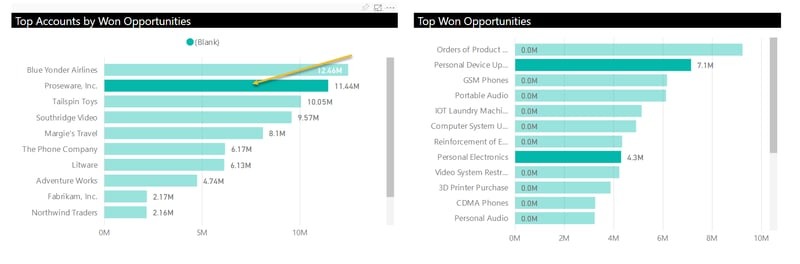
 What is really interesting with Power BI, is that within the same dashboard, you can refine the visualization by clicking on a specific account to see the top won opportunities gained from it only:
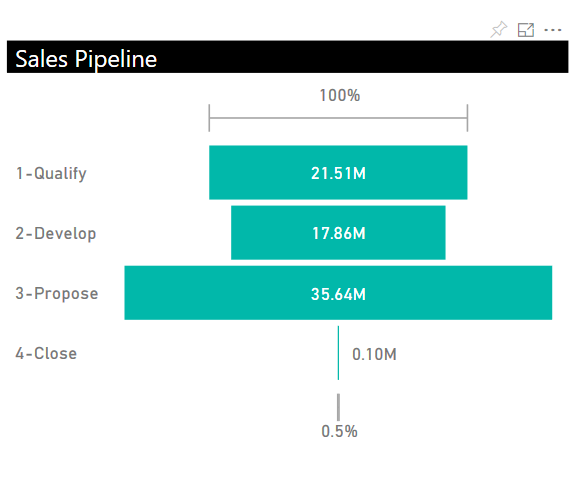
In the “Sales Pipeline” tab
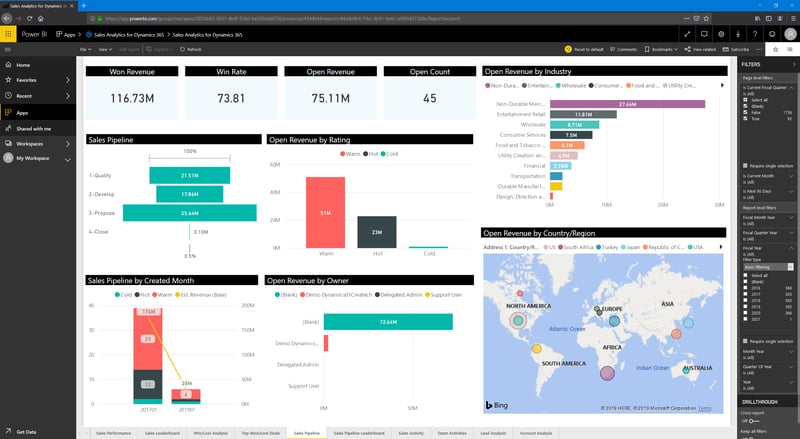
7. Access your “Sales Pipeline” based on the different steps comprised in your sales process:
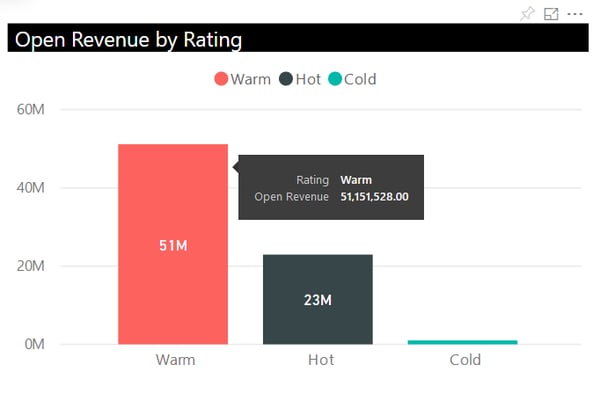
 8. This report targets the “Open Revenue by Rating”:
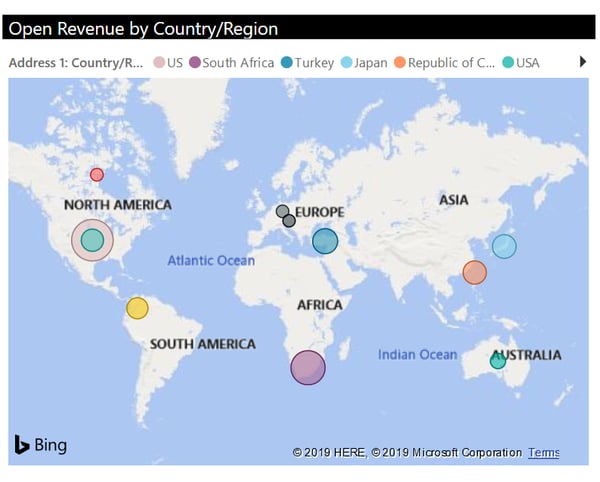
9. A geographical distribution of your leads is also available:
In the “Leads Analytics” tab
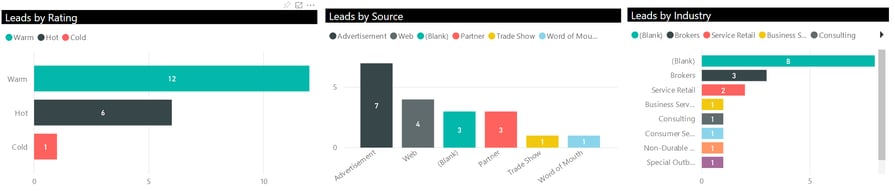
10. The analysis of leads is particularly relevant in any B2C (Business to Costumer) relationship:
Among others, these 3 reports (Leads by Rating, Leads by Source and Leads by Industry) offer and good overview of leads in a Sales/Marketing setting.
Conclusion
These reports are fundamental to the analysis of your data, which you can also configure according to your specific business needs. What is essential in the visualization and analysis of data is to be able to rely on powerful systems that are easy to set up as is Power BI. However, your data must be of good quality for you to draw relevant insights from it.
As promised, you can see that with minimal effort, you can benefit from a relevant analysis of your data. Accessible on any type of devices, you can visualize your reports at any time, using the Power BI mobile application (available on App Store and Google Play) or on a traditional web browser.
A system such as Microsoft Dynamics 365 CRM is the perfect tool to maintain the standard of your business processes and provide full support to your day-to-day operations.
