


In our last article about business intelligence (BI) and balanced scorecards, we discussed the importance of gathering the right KPIs that will support your long-term vision and help you implement your strategy. Leveraging the company’s data to understand its performance through dashboards and predictive analysis is what we commonly call “Business Intelligence.”
One of the most basic forms of BI is to export data in MS Excel and build reports, charts and trends in a workbook. This helps you understand what’s happening now and what has happened in the past.
Nowadays, multiple business intelligence platforms automate and enhance this process by adding a predictive dimension to your dashboard and help you analyze what your company should be doing in the future.
Your Company Generates More Data Than You Think
 When you think about your company’s data, you think about structured and well organized data. For the most part, you usually think about your accounting transactions, financial statements, inventory records and statistics that you pull from your social media platforms.
However, 90% of the data remains unstructured1, and your company could be sitting on a gold mine to get that highly sought-after competitive advantage by leveraging and organizing this existing data.
One of the main reasons why this data remains unstructured is the lack of relationships between members of the organization. In healthcare, for example, medical imaging, transcript with patients, and patient records are generated every day for all kinds of patients. The benefits of structuring and analyzing this data would be gigantic for the patients’ treatments, public health management, and medical research. With a well organized data set, the cause-and-effect relationships would be more obvious for the medical staff. Healthcare providers are now well aware of this, and in 2022 only, these companies increased their investment in advanced analytics by 50%2.
Traditional BI vs. Self-Service BI
Traditional BI refers to the original way of implementing data analytics tools with a dedicated IT team to support the business.
The deployment of a complex IT environment, and the very rigid processes make the learning curve of the user interface very steep. Nonetheless, it remains a first choice for departments with complex rules and hierarchies of information such as accounting.
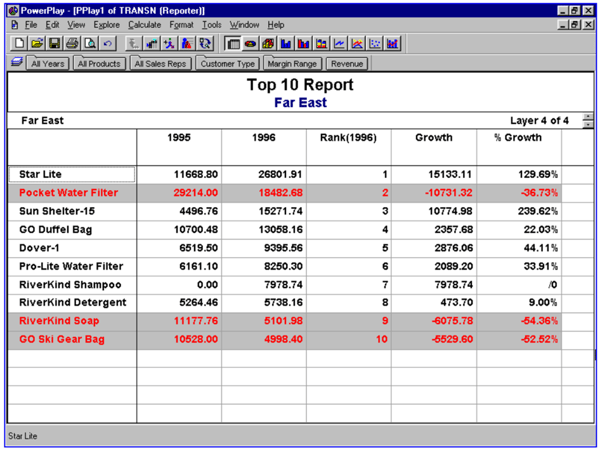 Cognos was developed in the 1970s and is still used to this day by some big public companies3.
One of the major drawbacks is the high costs associated with a system change or update.
Self-service BI has made the business analytics more mainstream as the user interface is more interactive and optimized for an easier user experience.
The data can be accessed and analyzed without previous experience in programming or statistics.
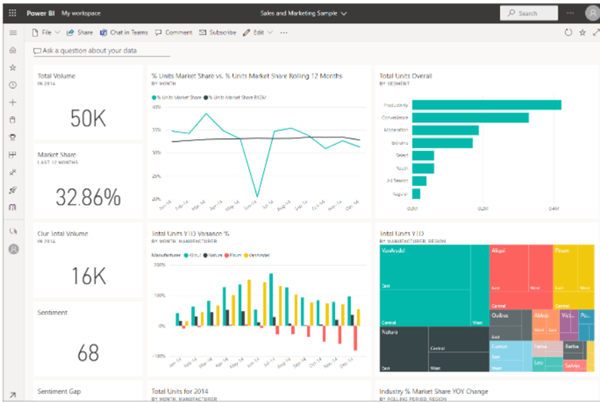 Custom dashboard built with PowerBI4.
Very little training is required for the user to log in and start working on the data with a direct access to advanced functionalities in report design and forecasting.
Your Dashboards Updated in a Few Steps
Your company has now built a good list of the KPIs its departments want to track. The next step is setting up processes to feed the KPIs regularly without hiring a team just for data crunching.
The work starts with organizing and standardizing the way you are collecting this data with few internal process adjustments. Once the data is ready, you will be able to load it into a BI platform where the transformations can be done and automated for future loads.
Not only the data transformation will be set up once and for all in the BI platform, but relationships between your dimensions will be suggested, KPIs calculated, and dashboards updated.
What was taking your team hours to update every now and then is now updated automatically in a few minutes.

The Next Wave of Disruption
Among the benefits of integrating a BI platform in the company’s processes, we can list the following:
- Processing large volumes of data to generate KPIs and dashboards
- Automating calculations, data clean-ups and validations
- Refreshing dashboards for different uses (social platforms, internal communications, reports to shareholders)
- Flagging defects in the production process
- Generating driver-based decision trees
These enhancements come with a direct added value on labor-intensive work performed on a regular basis. They also offer a bigger depth on the quality of the insights for both the management and the analysts.
 The next wave of disruption in the business intelligence and analytics industry will come through substantial improvements of the foundation being built so far. SAP recently unveiled SAP Analytics Cloud, their new BI and performance planning tool, a solution that already comes with a set of predictive functions and decision-making trees to simulate the impact of very specific drivers on the bottom line of an entire organization, using an integrated machine learning approach5.
These AI algorithms are getting better with monthly software updates from SAP. Thus, the companies that have a BI architecture ready to make profits off these enhancements are building a significant competitive advantage in the market.
In a Nutshell
Companies are overloaded with data, and a business intelligence strategy relies on organizing that data and supporting it with the right technology to improve analysis efforts and avoid blindfolded decision-making. BI platforms handle large amounts of data to identify and develop business opportunities. They are scalable, customizable for new KPIs, they add a new depth to the business analysis thanks to their machine-learning capabilities, and hence will grow with the company over time. Need to discuss how your BI strategy can be improved? Contact us today!
- Business Intelligence, Balanced Scorecards and Enterprise Performance Management: Complementary Tools for Focusing on Performance (createch.ca)
- https://www.cio.com/article/220347/ai-unleashes-the-power-of-unstructured-data.html
- https://www.forbes.com/sites/gilpress/2021/12/30/54-predictions-about-the-state-of-data-in-2021/?sh=1f983642397d
- https://web.archive.org/web/19970605031509/http://www.cognos.com/busintell/products/powerplay.html
- https://docs.microsoft.com/en-us/power-bi/create-reports/service-dashboards-design-tips
- https://blogs.sap.com/2020/08/22/extending-machine-learning-with-sap-analytics-cloud-doing-explorative-predictive-analytics/
