


Enterprise asset management (EAM) systems provide a lot of information about the operation and care of critical systems. To get the most out of Maximo, it is essential that current data and analysis of that data are readily available to help with making decisions. The usual solution to this is a report or some high-end business intelligence (BI) tool. But this begs the question: are the other available tools in Maximo being utilized at their best? Let us find out!
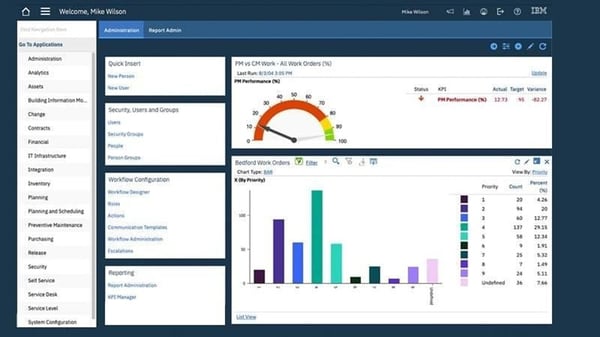
Figure 1 - Typical Maximo Start Center.
Downloads
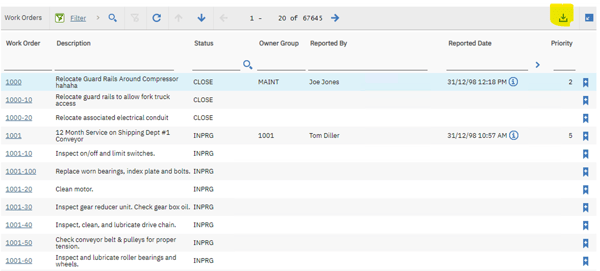
Figure 2 – Position of the “Download” button
Virtually every list in Maximo has the option to download the list in Excel format. Spreadsheets are time-honoured tools for conducting analysis on system data. If it is desired to better utilize this functionality, consider the information that a list provides. A typical list tab in Maximo includes a selection of data intended as previews for the records they represent. Caution is taken to make sure that no list is too wide to avoid horizontal scrolling, but sometimes that is unavoidable. Data that has great value when downloaded can be added to the List tab on the far right to keep relevant preview data readily visible.
This is a limited although easily employed tool for data gathering. It is limited due to being constrained by the visible data presented in the list, but it also comes with the power of the filtering functionality of the List tab, both as presented immediately and through the Advanced Search option.
Optimizing lists that are relevant for the business is an excellent first step in improving access to Maximo’s collected data.
Queries
After some time of operation, lists of work orders, assets, service requests, etc. can grow rather large. Finding exactly the information needed can be a complex and time-consuming process, even with a report to crunch the numbers and produce readily consumable information. Typically, there are groups of data that are repeatedly needed such as all records belonging to a specific user or user’s group, all open records, all records on the specific user’s site, and so forth. This can be accomplished by means of a query.
![]()
Figure 3 – Work Order Tracking list filtered to In Progress records using the filter bar.
![]() Figure 4 – Advanced Search options for Work Order Tracking showing the INPRG filter from the filter bar plus a search for Corrective Maintenance records.
Figure 4 – Advanced Search options for Work Order Tracking showing the INPRG filter from the filter bar plus a search for Corrective Maintenance records.
Most applications in Maximo have the query functionality built into them. Firstly, the data required should be determined for each specific query. What criteria go into filtering for getting the desired results? Most importantly, is it useful? Document them, then filter for that information using the Filter row in the List tab and in the Advanced Search facility also available in most Maximo applications. Once a list of records that accurately reflects a need is populated (e.g., all of the user’s current work orders), then it is time to create a query.
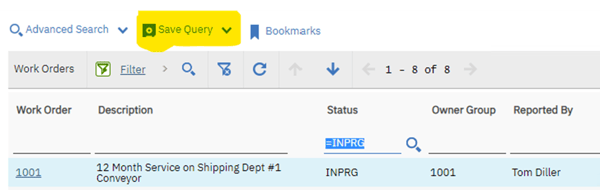
Figure 5 – Position of the Save Query button.
With the filters in place for your query and the correct data showing, click on Save Query at the top of the List tab.
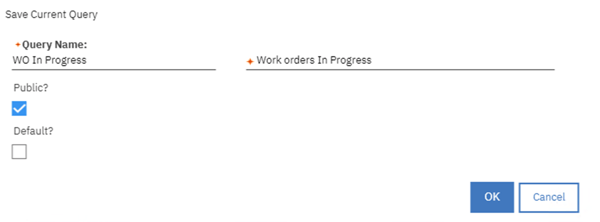
Figure 6 – Save Query dialogue.
In the dialogue, enter a name for the query and a longer description. If the intention is that this be available for everyone, check the Public box. If this should be the default query for the current user, select Default as well. Click on OK when done. The new query will now be available in the list of available queries, and highlighted if it is the default query.
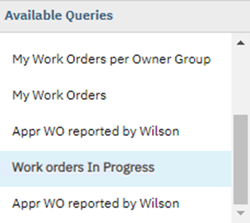
Figure 7 – The new query available under Available Queries.
Existing queries may be changed by their creating user. Click on the drop-down button next to Save Query and select View/Manage Queries.
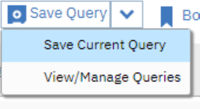
Figure 8 – Path to the View/Manage Queries button.
Click on the icon to the left of the query to be updated and the WHERE clause should appear at the bottom of the dialogue. Once all query changes have been made, click on OK.
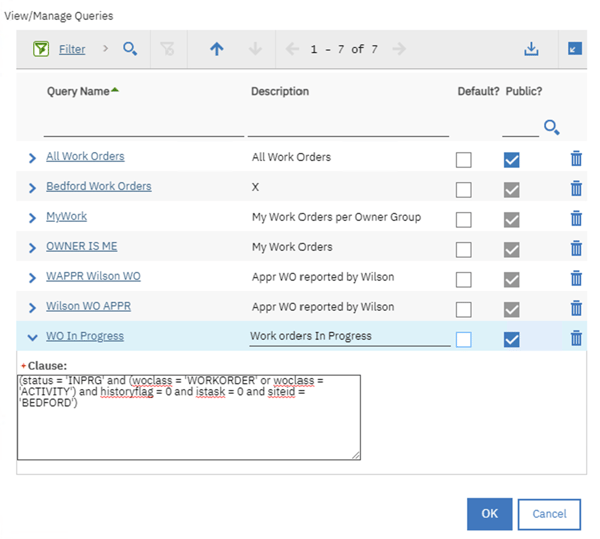
Figure 9 – View/Manage Queries dialogue with the new query selected.
For those with knowledge of SQL (Structured Query Language) and the Maximo data structure, more advanced queries can be crafted using the WHERE clause feature in the List tab. It is in the drop-down menu for Advanced Search.
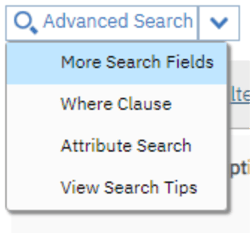
Figure 10 – Path to the WHERE clause button.
The WHERE clause is the literal SQL WHERE clause used to generate the data in the list, and is the very information saved in the query. The WHERE clause dialogue allows this information to be edited using SQL statements. It is assumed that the SQL query preceding this clause would be, for the Work Order application:
select * from workorder where
Please note that this means access to SQL tools like joins are unavailable. All work must be done in the WHERE clause.
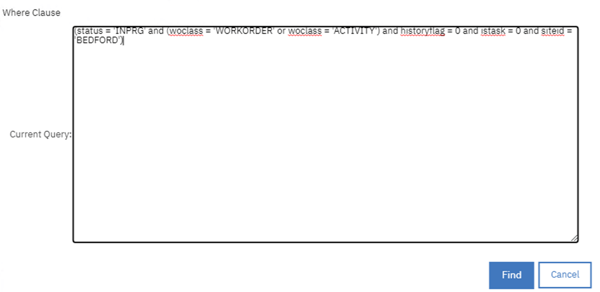
Figure 11 – Editing a WHERE clause.
Queries may be further enhanced using Maximo’s special bind variables. The query shown above was created to display all records that match Maximo’s default work order listing and be in progress (status of INPRG). A commonly desired detail is to involve the notion of ownership. So, to alter this In Progress query further so that it also filters out work orders not reported by the current user, the query would need to be changed in View/Manage Queries as shown below:
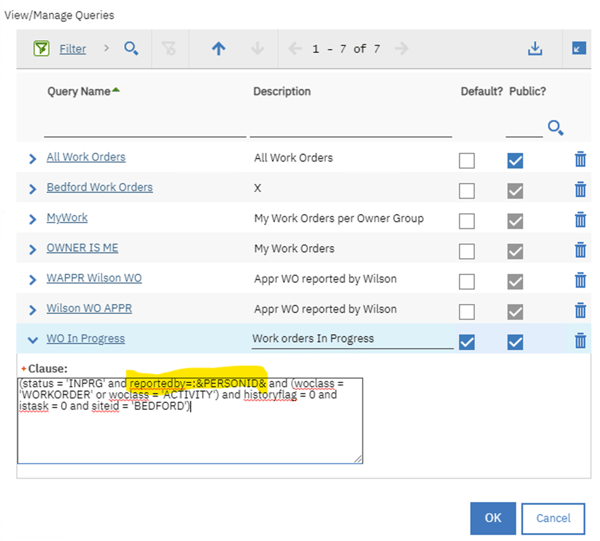
Figure 12 – Using a Maximo special bind variable in a query.
The choice of :&PERSONID& instead of :USER is because the reportedby field is a person. One need not be a Maximo user to have reported the need for a work order!
The following is a list of available Maximo bind variables and a quick description:
:&OWNER&
It represents the MBO (Maximo Business Object) that is the owner of the current MBO. This is always used in combination with a field name or relationship name such as :&OWNER&.ATTR1 or :&OWNER&.RELATIONSHIP2.ATTR2. It is used when you need to get to a value of an object on the owner MBO or through one or multiple relationships from the owner MBO. This comes in extremely handy if the current record has not been saved to the database and you need to get its value or its related value.
:&APPNAME&
It represents the application name that the current MBO is accessed through. For example, an object displayed on a dialog of WOTRACK application will have its application name as WOTRACK. But there will be cases where no owner application is associated to an object, and in that case, an empty string will be returned. This variable is normally used in the conditions for conditional UI or data restrictions.
:&MBONAME&
It represents the name of the object. It comes in handy when you define a common condition across different similar objects.
:&OWNERNAME&
It resolves to the name of owner object of the current object.
:&PERSONID&
It resolves to the PERSONID of the current logged-in user.
:&USERNAME&
It resolves to the current login user name.
:&DATE&
It represents a data string of current date when used in expression such as for communication template, and a real JDBC date function wrapping around the current date if used in relationships.
:&DATETIME&
Save as &DATE& but in DATETIME format.
:&HOSTNAME&
Normally used in communication templates, it represents the URL of the server. It is as the property mxe.hostname.
:&UNIQUEID&
It resolves to the unique ID of the current object.
:&synonymlist&_
This keyword is in lowercase. This resolves to a list of synonym values that can be directly used in an SQL. Following the &synonymlist&_ keyword, you specify the synonym domain name and a list of internal values.
:&synonymlist&_DOMAINNAME[VALUE1,VALUE2,...ETC.] will give you a string of ('synonymofvalue1', 'synonymofvalue2'...etc.). This is very much recommended to be used in the relationship WHERE clause when you need to qualify the records by the synonym values of a synonym domain. The reason is that the resulted query will offer much better performance compared to a subselect of a synonym domain table.

Key Performance Indicators
Available in a user’s start center, key performance indicators (KPIs) can be used to provide snapshots of vital data in Maximo. The information provided by a KPI is a single number, but that number can be a count of certain entries, a sum of values, a measurement from a meter or any other vital piece of information. This number can be measured against a target value, a warning value, and an alert value.
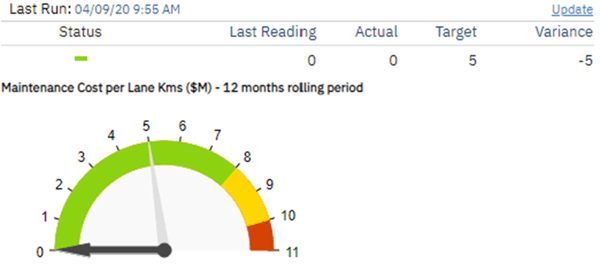
Figure 13 – Appearance of a single KPI.
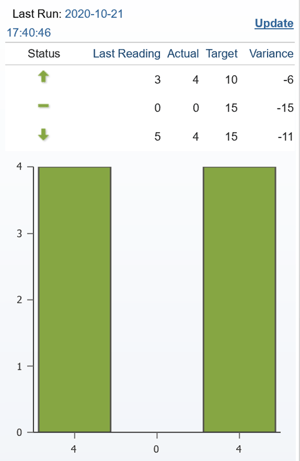
Figure 14 - Three KPIs at once.
A KPI entry in a start center can be either a single KPI or multiple related KPIs. A single KPI (downtime per month, late work orders, etc.) allows the display to focus on a single important statistic. Displaying multiple related KPIs (work orders per maintenance group, temperature on different instances of the same device, wear on tires, etc.) allows not only the monitoring of each value, but compares those values letting workloads be balanced or noticing issues when values change at different rates, for example.
Any KPI may be linked to a source of external information such as another complementary KPI, or a report which may allow for a deeper dive into the causes behind the results from the KPI. This puts more information in the hands of users to see developing problems and make informed decisions.
The most important feature of a KPI is its record of historical values. These values may be displayed graphically, providing a clear trend for the KPI values, predicting problems and when to expect them. This information is vital in predictive maintenance.
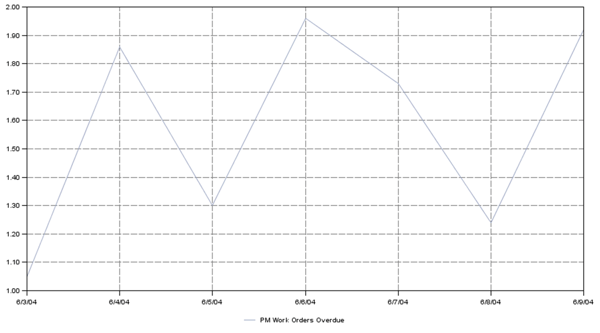
Figure 15 – KPI trend graph.
Historical values can also be shown in a list. Lists may be downloaded into a spreadsheet allowing further analysis.
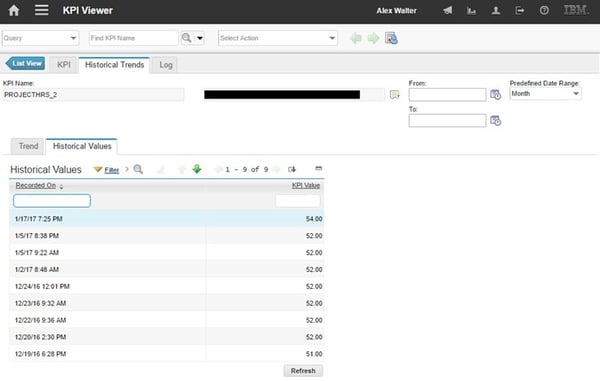
Figure 16 – List of historical KPI values.
KPIs are configured in the KPI Manager application.
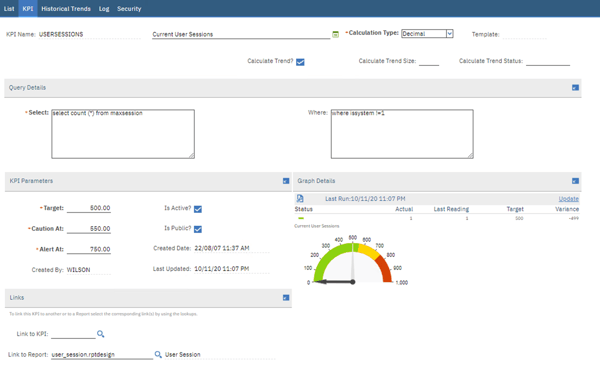
Figure 17 – KPI Manager application.
The first section provides all the basic information about the KPI.
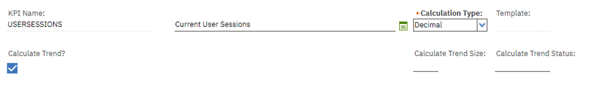
Figure 18 – KPI header block.
At the top of the KPI is the name and description of the KPI. As usual, make this as descriptive as possible so all end users know what it is all about. Also, the results from a KPI can be decimal or percentage type, and one can also choose to calculate trend data.
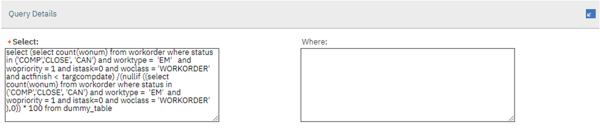
Figure 19 – KPI Query Details.
The next section is the heart of any KPI: the query. This is an actual SQL query divided into everything preceding the start of the WHERE clause such as SELECT and FROM (SELECT) and everything following the start of the WHERE clause like WHERE and ORDER BY (WHERE). SELECT is the only required field, accommodating queries in which everything is in the SELECT and FROM clauses.
Remember when building a query for a KPI that the product of it will be a single number. Anything different from this will be invalid.
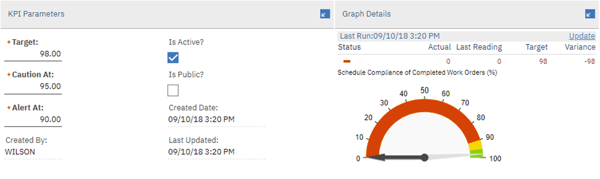
Figure 20 – KPI parameters.
The parameters for a KPI define what the data means. There are three parameters to be set: Target, Caution At, and Alert At. Target is the ideal value for KPI measurement. The number at which to become concerned is the Caution At value. Finally, alarms will be going off and the object which is the focus of the KPI should be investigated if the KPI produces a number beyond the Alert At point. A KPI will be ascending if Alert At is larger than Caution At, otherwise it will be descending.
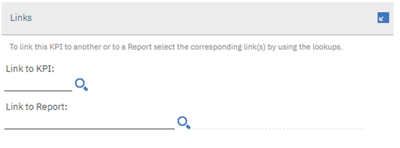
Figure 21 – KPI links.
A KPI, as mentioned earlier, may be associated with another KPI or ever a report. The KPI or report to which it is linked should provide more details about the subject of the primary KPI. These associations are defined in the final block of the KPI definition, Links.
Result Sets
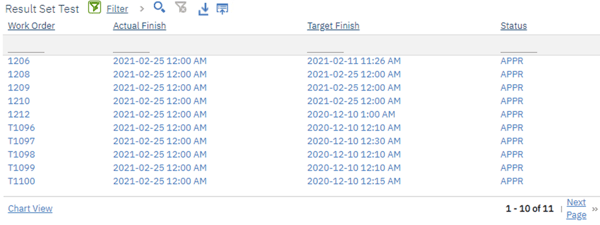
Figure 22 – A typical Result Set.
A result set is a focused set of data provided for the user in the user’s start center (dashboard). The data provided is usually chosen for its utility in the user’s role.
Each result set is based on a Maximo application and a saved query from that application that controls what data will appear. When being set up, the columns can be chosen from the list of all fields in the application’s main table. Please note that the columns are not limited to the columns shown in the list view of the application.
Clicking on any object in a row will take the user to the record in the owning application for a more in-depth review. As such the choice of columns should provide the user with all the information needed to determine if a deeper review is needed. As stated above, this will be determined by the role played by the user in the organization.
Any result set may be configured to have a chart option as well. If one has been configured, then the result set will display Chart View at the bottom left, otherwise the choice will be Set Chart Options. Clicking on Set Chart Options will bring up the following dialogue where the chart type, value to count against, and whether to display the chart first instead of the list may be selected:
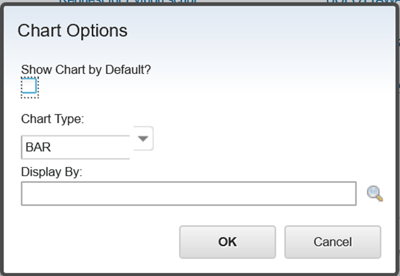
Figure 23 – Available chart configuration options.
Once configured, the chart may be displayed, providing a unique perspective on the data:
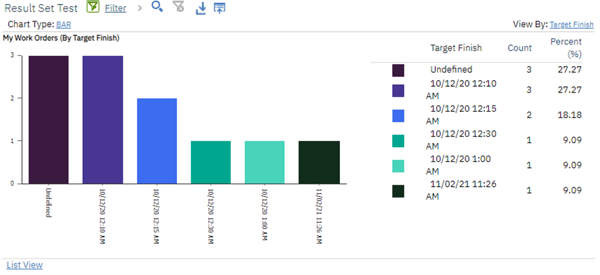
Figure 24 – A Result Set bar chart.
As indicated, the columns for the non-chart display may be chosen which will offer the user a view on the records different than the standard list view for the application. To make a change, roll the cursor over the top right corner of the result set in the start center and click on the pencil icon when the controls appear.

In the control dialogue, the first tab provides the option to control the content of the result set list. Any of the fields from the object associated with the application are available for use. In addition, the result set control makes use of reporting object structures which provide the chance to include related information external to the owning application. Due to the limitations of the result set display, only data with a one-to-one mapping is available for use, so fields from a related asset can be included, but information from all related tasks cannot be.
Within the result set display there is limited space, so all the desired columns may not fit well. One should be aware of this when selecting columns. The columns should be prioritized into “must have” and “nice to have,” so should there be too many, some of the “nice to have” columns can be removed. The dropped columns can be included in another result set with a different theme. Also remember that the user can always jump to the owning application for more details.
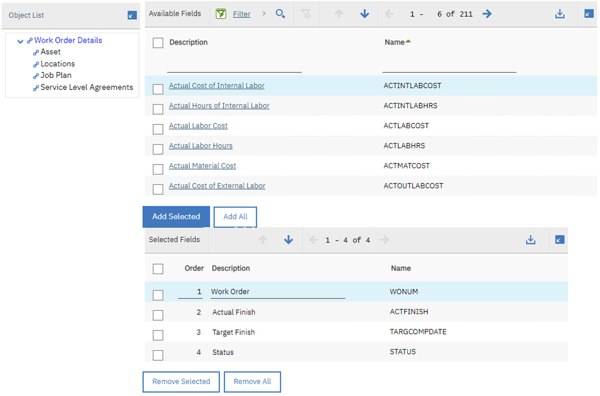
Figure 25 – Selecting columns to display for a Result Set.
The last point for result sets is employing color options. As all the tools on the start center are intended as “quick glance” solutions, it makes sense that optimizing result sets to call attention to points of concern would be essential. This is the purpose of Color Options, the final tab in result set configuration.
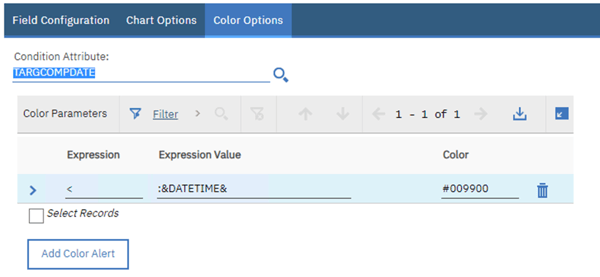
Figure 26 – Highlighting records of interest using color.
Color Options allow for multiple conditions to be tested against one of the previously selected columns (TARGCOMPDATE in the above example). For each condition to be highlighted, a single row must be created to describe the condition to be tested and the color to be used. Tests are simple with comparison options of equal to, greater than, greater than or equal to, less than, and less than or equal to. The chosen column may be compared against a value and if the result is true, the line the value was from will be shown in the requested color. No complex queries are allowed.
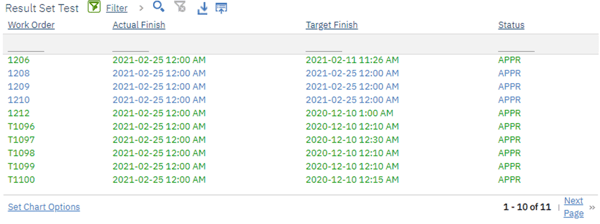
Figure 27 – Result Set with late records highlighted in green.
The value to be compared against can be literal (i.e., exactly what is typed) or one of Maximo’s special bind variables such as :SITEID or :&USERNAME&. A literal value can be any group of alphanumeric values like 12 or APPR. For those familiar with SQL, note that values being compared against alphanumeric fields do not need to be contained within single quotation marks.
As a note for the use of bind variables, one of the more useful ones available is :&DATETIME&. This will produce the current date and time and is perfect for determining items which might be past due. These variables do not require the use of quotation marks either. Do not forget the initial colon.
Other Topics
The biggest topic conspicuous by its absence is that of Ad Hoc Reporting. This is an extremely useful way to get more complex information out of Maximo and it builds on some of the information covered in this blog. However, a review of the functionality of Ad Hoc Reporting and how to enhance it is the topic of another blog. In the meantime, should you require more information on the subject, do not hesitate to contact us.

